
Statistical correlation is the phenomena assessed by covariance in statistics. If there is a quantifiable relationship between two random variables or bivariate data, we say they fluctuate together. The degree of cloud coverage and rainfall precipitation in a specific region is a simple example. When we plot the two variables together, we can see that they tend to change at the same time, implying that they are statistically related. The cause of such joint variability could be direct, indirect, or completely fictitious.
The assumption of linear dependency is used when using covariance. The direction in which the dependent variable (Y) tends to fluctuate with changes in the independent variable (X) is indicated by the sign of the covariance calculated for two variables, X and Y (denoted cov(X,Y)) . A positive covariance indicates that as X increases, so does Y. Increases in X are associated with decreases in Y with negative covariance.
A covariance of zero indicates that there is no statistical relationship (orthogonality), but it does not imply statistical independence. The magnitude of other values of cov(X,Y) is difficult to comprehend in practise because it is dependent on the scale of both variables’ values. This is why a standardized version of covariance known as a correlation coefficient is used instead for most practical uses. It allows for comparisons of the joint variability of variables on various scales.
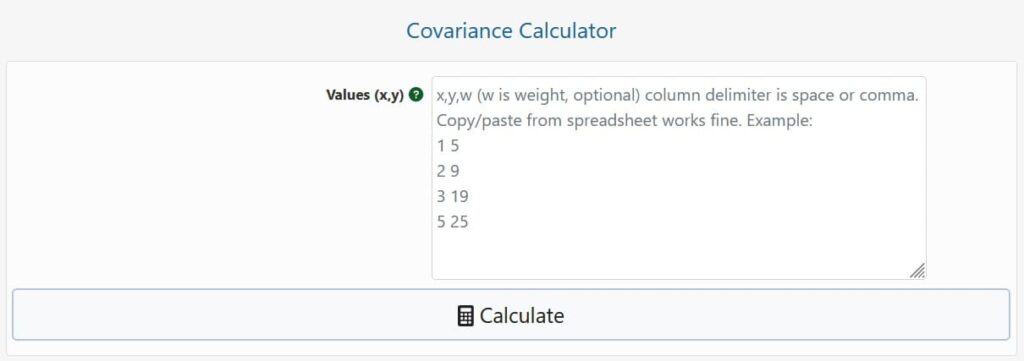
To use the calculator, first enter your data: one column per variable, X and Y. You can also add pair weights in a third column, which will be applied to the values and result in a weighted covariance. Spaces, tabs, or commas must be used to separate columns. Copying and copying from Excel or another spreadsheet programme should be fine. There should be an equal number of rows in each column.
The sample covariance, population covariance (see below for the distinctions between the two), the arithmetic mean of X, the mean of Y, and the count of samples are all outputs of the covariance calculator when you hit the ‘Calculate’ button (pairs).
For computing covariance, there are two somewhat different equations. As mentioned below, which one is appropriate based on the type of data and analysis.
Population covariance formula
The formula for computing population covariance is:

where cov(X,Y) denotes the covariance of the variables X and Y, and is the Greek upper-case letter “sigma,” the commonly used symbol for mathematical summation, x-bar denotes the sample mean of the X data set (x-mean), y-bar denotes the sample mean of the Y data set, and xi and yi denote elements of these datasets indexed by i. If the observed values of X and Y represent the entire population of interest, then this formula applies, and it is a population parameter derived from the joint probability distribution. Because this is uncommon in practise, the covariance formula below is most commonly used.
Sample covariance formula
The formula for sample covariance is:

The denominator is n-1 instead of just n, which is effectively the same as for population covariance. Because the data is only a sample, this adjustment reflects the increased degree of freedom that comes with it. A statistical estimate of the covariance of a bigger population based on samples from two random variables is such a covariance.
Our covariance calculator supports both equations, making it a simple approach to investigate the relationship between the two estimations.
Covariance is used in a variety of scientific and applied fields, including financial economics, genetics, molecular biology, machine learning, and more. Principle component analysis (PCA) uses covariance matrices to reduce feature dimensionality in data preprocessing.
A stage in calculating a correlation coefficient is calculating covariance. A correlation matrix is built on the foundation of a covariance matrix. Correlation coefficients are commonly used because of their standardised measure, which allows comparing covariances across many different scaled variables.

© 2021 All rights reserved
Ask Your Query