
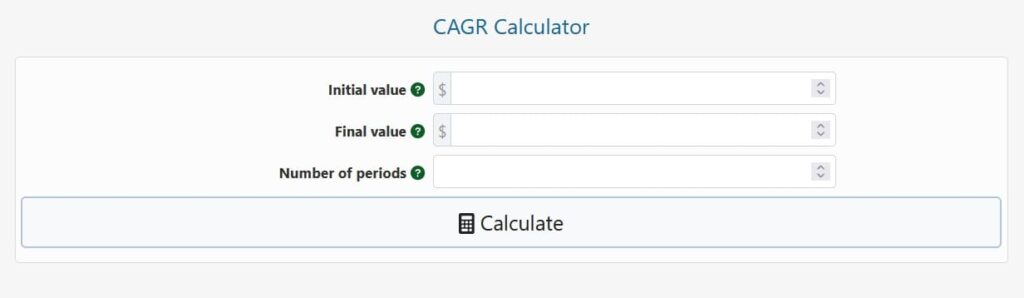
Our CAGR calculator is a basic and straightforward tool for calculating an asset’s average rate of growth. In the Initial value field, enter the value of the investment you made or the revenue generated by your firm at the start of the interest period. Enter the current value of the investment or current business revenue in the “Final value” area, or the asset’s final value at the conclusion of the interest period. Finally, specify how many periods the value has grown over.
After you’ve filled them in, hit “Calculate” to view the current value and compound growth rate (annual if you entered years as periods, other otherwise).
The average compound annual growth rate of an asset, an investment, or business results such as sales, revenue, clients, users, units produced or delivered, and so on is known as the CAGR. It can be the quarterly, monthly, weekly, or other growth rate when calculated for a time other than a year. It’s beneficial for comparing growth rates across different data sets in the same domain, such as revenue growth of companies in a specific industry or revenue growth of different company divisions within the same corporation.
So, how do you figure out CAGR? You can accomplish it on your own or with the help of an Excel spreadsheet if you use the formula:

where V(t0) is the starting value, V(tn) is the ending value, and tn – t0 is the number of time periods over which the growth has occurred (years, months, etc.). For example, if a company’s year-end revenue in 2010 was $10 million and it was $25 million in 2018, the compound annual growth rate is CAGR(0,8) = (25000000 / 10000000)1/8 = 12.135 %. Although the name implies that it should be calculated over a year, the same method may be used to determine growth rates on a monthly, weekly, or daily basis. Our CAGR calculator, of course, makes the procedure a lot easier.
The geometric mean of the increase throughout the number of periods of interest is used to calculate the CAGR. This is the proper approach to figure out average growth. The arithmetic mean, on the other hand, would yield an inaccurate result (typically greater) since the average of ratios is not the same as the arithmetic mean.
The sample above shows a single calculation. Let’s have a look at what occurs when different financial factors are used. Assume you made a $10,000 investment five years ago and want to know what your compound annual growth rate was throughout that time. The CAGR column of the table below contains the answers for numerous different end value situations.

If the number of years is fixed, the investment’s compound yearly growth increases in lockstep with the increase in the predicted (or observed) final value.
Let’s look at another scenario in which we attain the same final result as the last row of the previous table and see how the time it takes to get there affects the average growth rate.

The time value of money is evident because the longer it takes to achieve the same absolute return, the lower the investment’s growth rate. The time preference inherent in all economic activity is reflected in this inverse connection.

© 2021 All rights reserved
Ask Your Query