
The break-even analysis is one of the most critical analytical tools you’ll utilise when running a firm. The B/E point is a measure that indicates how much sales must be achieved before profit can be realised. In other words, it’s the point at which all of your expenses are finally covered by all of your income.
When selling prices for the goods and services you offer, deciding on budgets, or simply working on a business strategy, our break-even calculator is a helpful tool to employ.
Break-even analysis is based on three important characteristics of a business operation: unit selling price, fixed expenses, and variable costs. The quantity you sell has no bearing on your fixed costs. Rent is an example of a fixed expenditure. Variable costs, on the other hand, are mostly determined by the volume of work at hand — if you have more clients, you’ll need more staff, which means higher variable costs.
With information on all three of these factors, you may use the formula to compute your break-even point:
Break-even point measured in units = Total fixed costs / (Selling price of a unit – Variable costs per unit).
In this example, you estimate the number of units you’ll need to sell before making a profit. The sum of all fixed expenses is calculated, whilst the price and variable costs are calculated per unit.
If you wish to compute your break-even point using only financial terms, use this formula:
Break-even point measured in $ = Total fixed costs / Contribution margin ratio,
where the contribution margin ratio equals the contribution margin divided by the revenue.
Another technique to figure out the break-even point in dollars is to look at the break-even point in units:
Break-even point measured in $ = Selling price of a unit x Break-even point measured in units.
Finally, we’ll look at the formula that will help you figure out how many units you need to sell to make your profit:
Number of sold units that provide the desired profit = Desired profit / Contribution margin per unit + Break-even point measured in units.
This is a step up from the basic calculations, but since you’ve already done the math on BEP, you can move on to more complex estimates with ease. In our break-even calculator, we use the formulas for number of units, revenue, margin, and markup to calculate them for you.
The break-even point is a crucial benchmark to aim for. You’ll come into this metric frequently as a business owner, accountant, entrepreneur, or even a marketing specialist, which is why our online calculator is so useful.
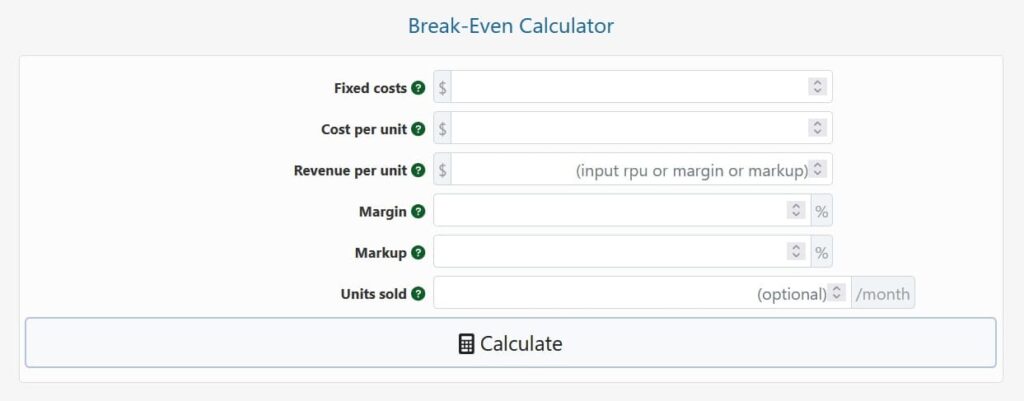
However, calculating the break-even point may be too difficult, therefore you can save time and effort by utilising this Break-even Calculator. All you have to do is submit information on your fixed costs, as well as your unit cost and income. You can include how many units you plan to sell per month to make the study even more precise.
The algorithm takes care of the rest, calculating your profit margin and markup, as well as your break-even point in terms of both units sold and cash revenue. If you’ve selected your sales goals, you’ll be able to see how long it’ll take to attain the BEP.
Calculating the break-even point might assist you figure out how much you need to sell to break even. Knowing this allows you to adjust your marketing activity if sales fall short of expectations or if you just want to hit the objective sooner. This research can also be used as a valuable resource for reducing costs and determining selling prices.
When you have this knowledge, running a successful business becomes easier and more feasible. It can mean the difference between running at a loss and meeting financial targets and increasing production.
A break-even analysis is easiest to perform when the quantities involved are represented graphically, which is why our calculator also generates a chart with all of them plotted. For an imagined business organisation manufacturing items at a cost of $10 per unit, selling them for $14 per unit, and having fixed operational expenses of $100,000 per year.
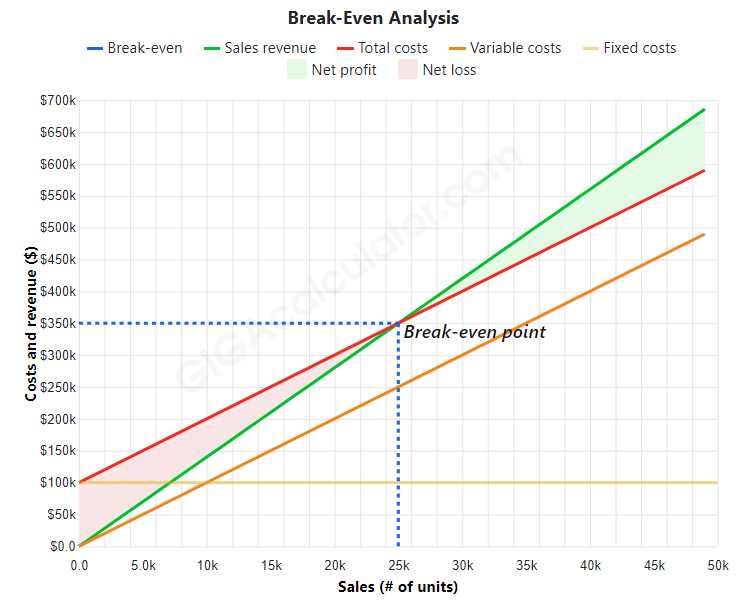
In the graph above:
Selling more units than the break-even threshold gives a margin of safety, which can be reflected in unit sales, revenue, and results. If the corporation sold 40,000 units instead of 25,000, the revenue would be 40,000 $14 = $560,000, with a cost of 40,000 $10 = $400,000, resulting in a net profit of $560,000 – $400,000 = $160,000. This sum of 160 thousand dollars represents the business’s safety margin as well as its net operating profit.

© 2021 All rights reserved
Ask Your Query