EXCEL VARP FUNCTION
Excel VARP Function Introduction
The VARP function in Excel returns the Variance of a given collection of numbers.
Description of Excel VARP Function
Syntax :
=VARP( number1, [number2], … )
Parameters :
- Where the number parameters are values or arrays of values that supply the function with a minimum of two numeric values.
Step By Step Guide of VARP Function
Example :
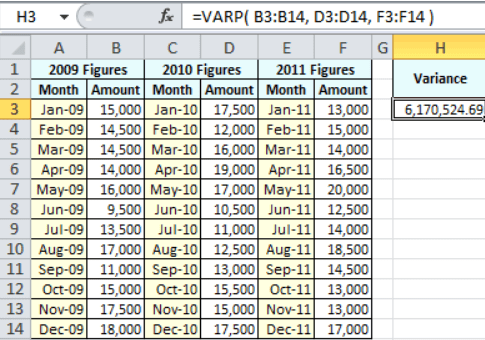
Over the course of three years, a corporation maintained track of its monthly sales numbers. These are saved in the sample spreadsheet’s fields B3-B14, D3-D14, and F3-F14.
Cell H3 of the spreadsheet calculates the difference between the three years’ sales data. This is the formula (given in the formula bar):
=VARP( B3:B14, D3:D14, F3:F14 )
The computed variance for the three years of sales numbers is 6,170,524.69, as shown in cell H3.

Key Points
In recent Excel versions, you may pass up to 254 number parameters to the Varp function (2007 and later). In Excel 2003, however, you may only insert up to 30 number parameters.
When determining the variance of an entire population, the Varp function is employed. If your data is only a sample of the population (for example, if your data collection captures the individual heights of a sample of UK men), you should use the Excel Var or Excel Var.S functions.
- #DIV/0! – Occurs if none of the values sent to the Varp function are numeric.
- #VALUE! – This error occurs if any of the values sent directly to the Varp function are text values that cannot be translated as numeric values.


