EXCEL VAR FUNCTION

Excel VAR Function Introduction
The VAR function in Excel returns the sample variance of a given collection of data.
Description of Excel VAR Function
Syntax :
=VAR( number1, [number2], … )
Parameters :
- Where the number parameters give the function with a minimum of two numeric values. Each number argument can be either a single value or a collection of values.
Step By Step Guide of VAR Function
Example :
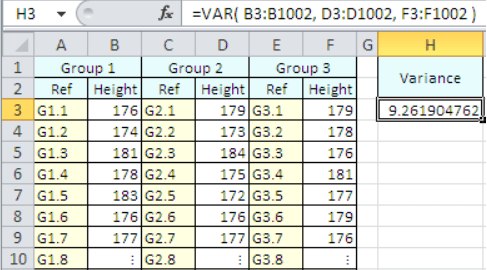
Assume you wish to know the range of adult male heights in London. It is not feasible to measure the heights of all males, however a sample of the population might be measured.
The sample on the right records the heights (in centimetres) of 3,000 adult males. Cells B3-B1002, D3-D1002, and F3-F1002 hold the measured heights.
The variation of the sample group’s heights is determined in spreadsheet cell H3.
=VAR is the formula for this:( B3:B1002, D3:D1002, F3:F1002 )
The variation of the sample group’s individual heights is determined as 9.261904762 cm, as shown in cell H3.
Key Points
- #DIV/0!
– Occurs if the function is given less than two numeric values. - #VALUE! – This error occurs if any of the values passed directly to the Var function are text values that cannot be read as numbers.
Related Functions
HLOOKUP Function
HLOOKUP Function
Explore NowVLOOKUP Function
VLOOKUP Function
Explore NowINDEX Function
INDEX Function
Explore NowMATCH Function
MATCH Function
Explore NowDATE Function
DATE Function
Explore NowIF Function
IF Function
Explore NowOR Function
OR Function
Explore NowAND Function
AND Function
Explore NowRANK Function
RANK Function
Explore NowSUMIF Function
SUMIF Function
Explore NowXIRR Function
XIRR Function
Explore NowWORKDAYS Function
WORKDAYS Function
Explore Now