

A trend is the general direction in which the market is moving during a given time period. While there is no set length of time for a direction to be considered a trend, the longer it is maintained, the more noticeable the trend becomes.
Uptrend
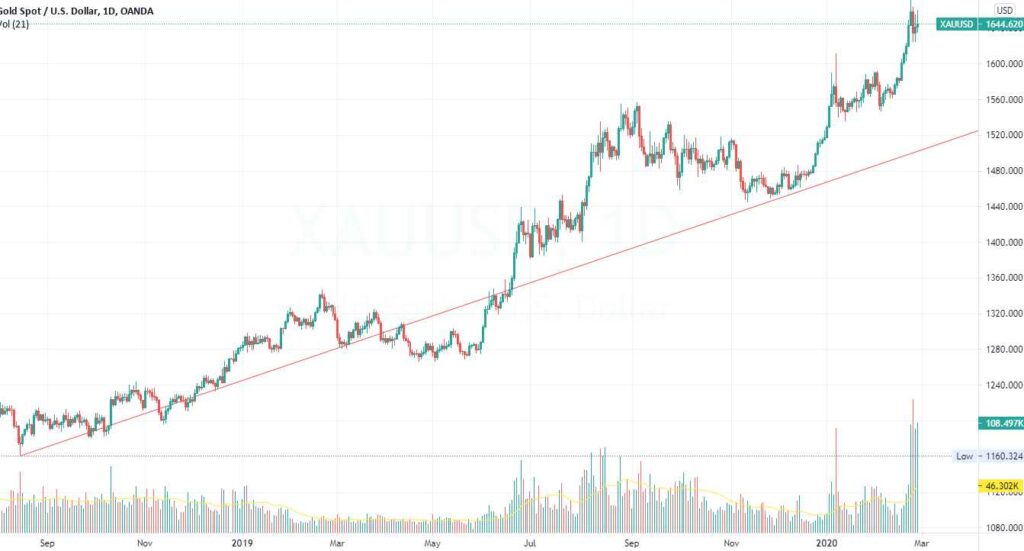
An uptrend occurs when the overall direction of a financial asset’s price movement is higher. In an uptrend, each consecutive peak and trough is higher than those recorded earlier in the trend. As a result, higher swing lows and higher swing highs characterize the upswing. The uptrend is regarded alive as long as the price delivers these higher swing lows and higher swing highs.
Moving Averages
A moving average is a technical analysis tool that smooths out price data by calculating an average price that is regularly updated. A moving average provides a single, flat line on a price chart, thus removing any differences caused by random price movements.
Moving Average Convergence Divergence (MACD)
The MACD (moving average convergence divergence) is an oscillating indicator. A technical analysis indication that varies over time inside a band is known as an oscillating indicator (above and below a center-line; the MACD fluctuates above and below zero). It’s a trend-following as well as a momentum indicator.
Relative Strength Index (RSI)
The relative strength index (RSI) is another oscillating indicator, but its movement is limited to a range of zero to one hundred, therefore it delivers information that is distinct from the MACD.
When the indication in the histogram is above 70, the price is considered “overbought” and due for a correction and when the indicator is below 70, the price is considered “oversold” and due for a bounce.
Share this Content
© 2021 All rights reserved
Ask Your Query