EXCEL T.TEST FUNCTION

Excel T.TEST Function Introduction
The T.Test function in Excel computes the probability associated with the Student’s T Test, which is often used to determine if two data sets are likely to have come from the same two underlying populations with the same mean.
Description of Excel T.TEST Function
Syntax :
=T.TEST( array1, array2, tails, type )
Parameters :
array1 – The initial data collection.
array2 gives the next data set (must have the same length as array1).
tails – The distribution’s number of tails. This might be either:
1 – Employs the one-tailed distribution
2 – Makes use of the two-taileddistribution – An integer indicating the kind of t-test. This might be either:
1 – Paired T-Test
2 – Two-sample equivalence T-Test
3 – Two-sample uneven variance T-Test
Step By Step Guide of T.TEST Function
Example :
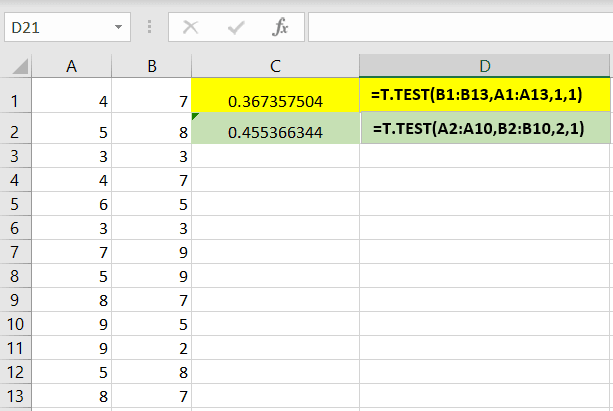
The spreadsheet on the bottom has two data arrays in columns A and B.
The spreadsheet on the bottom has two data arrays in columns A and B.
For the two arrays of data, the probability associated with the Student’s paired t-test with a one-tailed distribution may be determined using the Excel T.Test function as follows:
=T.TEST(B1:B13,A1:A13,1,1)
This yields the value 0.367357504.
For the same two sets of data, the probability associated with the Student’s paired t-test with a two-tailed distribution is computed as follows:
=T.TEST(A2:A10,B2:B10,2,1)
This yields the value 0.455366344.
Key Points
#N/A – Occurs if the lengths of the two given arrays disagree.
#NUM! – If any of the following criteria is encountered: The tails argument given can have any value other than 1 or 2. or The given type parameter is not one of one, two, or three.
#VALUE! – Occurs when either the supplied tails or type arguments are non-numeric.
Related Functions
HLOOKUP Function
HLOOKUP Function
Explore NowVLOOKUP Function
VLOOKUP Function
Explore NowINDEX Function
INDEX Function
Explore NowMATCH Function
MATCH Function
Explore NowDATE Function
DATE Function
Explore NowIF Function
IF Function
Explore NowOR Function
OR Function
Explore NowAND Function
AND Function
Explore NowRANK Function
RANK Function
Explore NowSUMIF Function
SUMIF Function
Explore NowXIRR Function
XIRR Function
Explore NowWORKDAYS Function
WORKDAYS Function
Explore Now