

Support and resistance tools help you to identify the potential support and resistance levels. They can also tell you about future targets and stop-loss of the stocks. Following are the popular and widely used support and resistance tools.
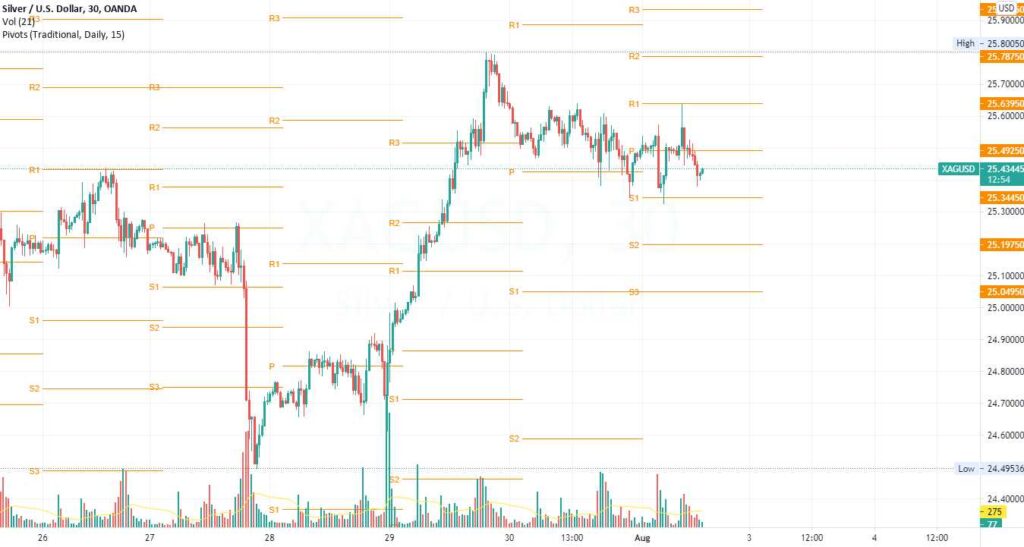
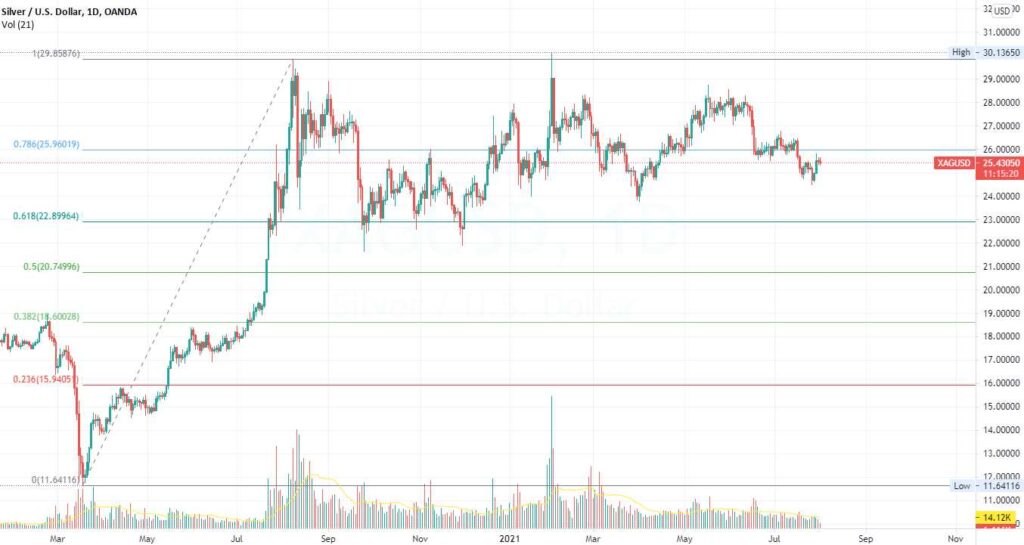
Retracement-
Fibonacci retracement levels are horizontal lines that show potential areas of support and resistance. Fibonacci numbers are used to create them. A percentage is assigned to each level. The percentage represents the amount of a prior move that has been retraced. Fibonacci retracement levels are 23.6 %, 38.2 %, 61.8 %, and 78.6 %.
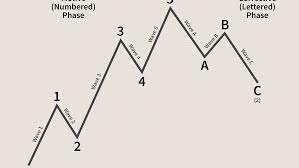
Extension-
Traders can use Fibonacci extensions to set profit targets or anticipate how far a price will go after a retracement or retreat is completed. Extension levels could also be potential price reversal zones. Extensions are drawn on a chart to indicate price levels that may be significant. Fibonacci ratios (as percentages) and the extent of the price move the indicator is applied to are used to determine these levels.
61.8 %, 100 %, 161.8 %, 200 %, and 261.8 % are common Fibonacci extension levels.
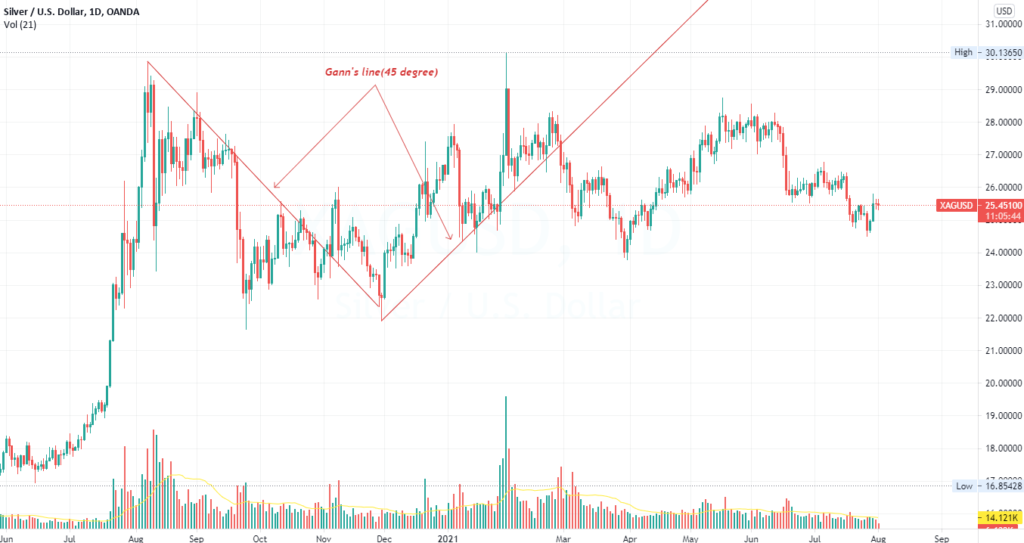
A line drawn at a 45-degree angle is known as a Gann Line. This line is also known as “one to one” (1×1), which signifies one price change in one unit of time.
The line with a 45-degree slope, according to Gann’s theory, denotes a long-term trend-lines (ascending or descending). The market is bullish as long as prices are above the ascending line. The market is considered bearish if prices remain below the declining line. The Gann Line’s intersection usually indicates a break in the underlying trend.
Traders can use support and resistance tools to identify and profit from stock market trends.
However, this does not rule out the possibility of the stock breaking through a support or resistance level. A stock’s price can always rise or fall. And as a trader, you shouldn’t make trades purely based on these levels.
Share this Content
© 2021 All rights reserved
Ask Your Query