Basics of Japanese Candlesticks.

Basics of Japanese Candlesticks.

Table of Contents

Brief history

The candlesticks are Japanese in origin, as the name implies. Candlesticks were first used in the 18th century by a Japanese rice merchant named Homma Munehisa.

Despite the fact that candlesticks have been used in Japan for a long time and are possibly the oldest type of price analysis, traders in the western world were unaware of their existence. Steve Nison, a trader, is said to have accidently discovered candlesticks in the 1980s and introduced the methodology to the rest of the world.
Components of Japanese candlestick

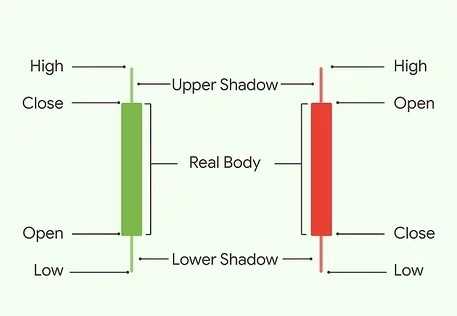
A candlestick chart, like a bar chart, displays the market’s open, high, low, and close prices according to the time frame. The “real body” is the rectangular section of the candlestick.
Components of Japanese candlestick
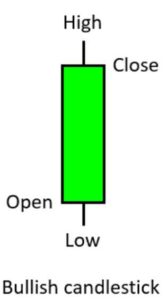
If the closing value is higher than open then it indicates bullish candle.
Bullish Candlestick
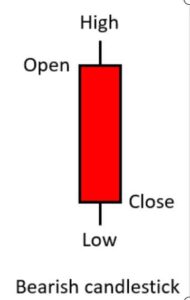
If the closing value is less than open then it indicates bearish candle.
Bearish Candlestick

Candlesticks v/s Bar chart

Bar charts and candlestick charts show the same information, just in a different way. Candlestick charts are more visual, due to the colour coding of the price bars and thicker real bodies, which are better at highlighting the difference between the open and the close.

Some popular candlestick patterns

  • Bullish engulfing.
  • Bearish engulfing.
  • Bullish Marubozu.
  • Bearish Marubozu etc.

Share this Content

Technical Analysis