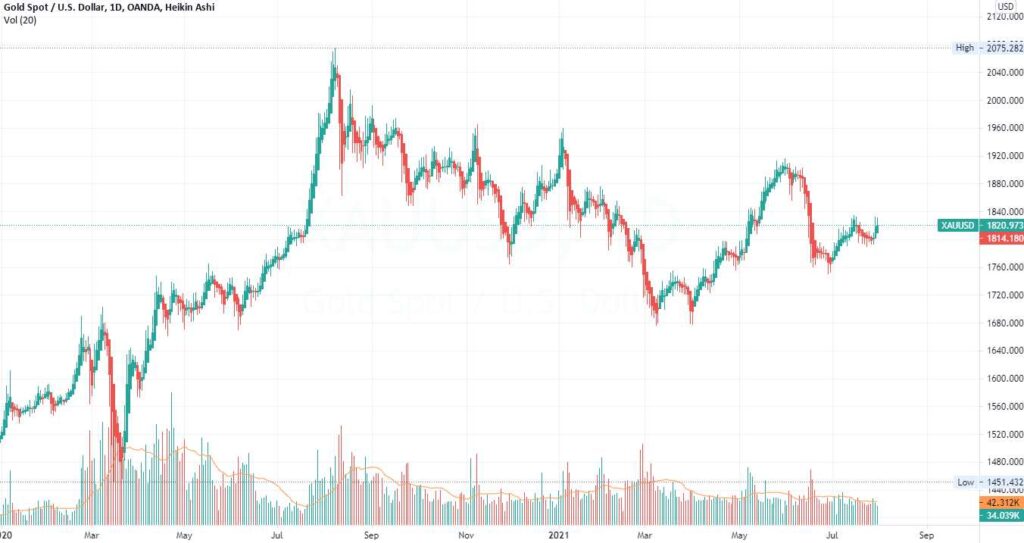
Basics of Charting

Basics of Charting

Table of Contents

Basics of Charting

chart is a graphical representation of price and volume movements of a stock over a certain period of time.

Chart scale

In the graphical chart, the X-axis represents the time period and the Y-axis represents the price movement.

Types of Chart

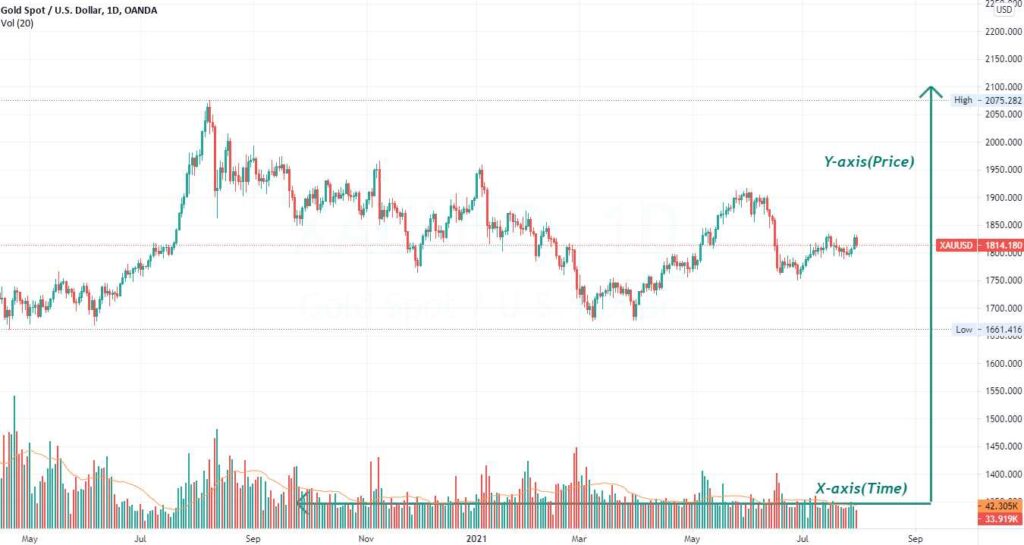
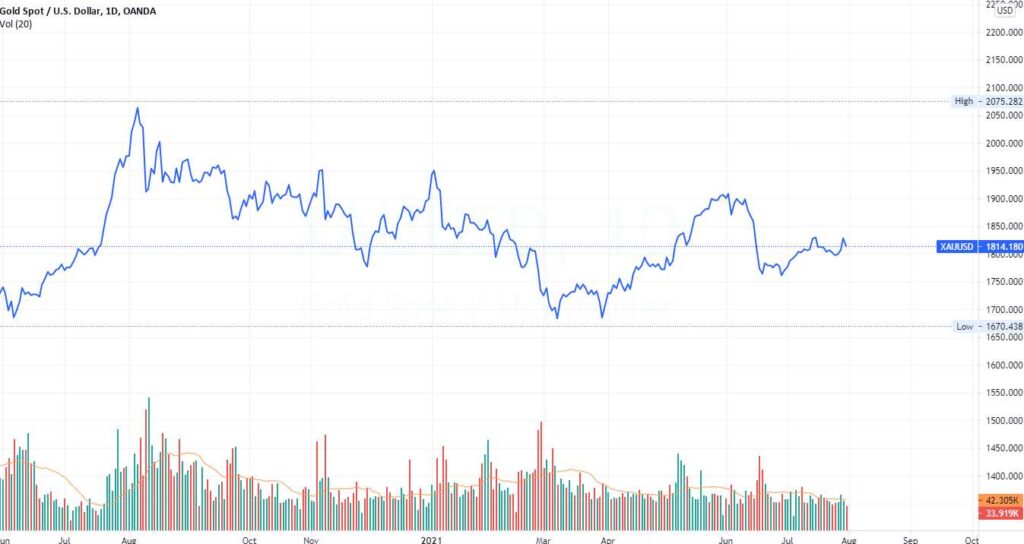
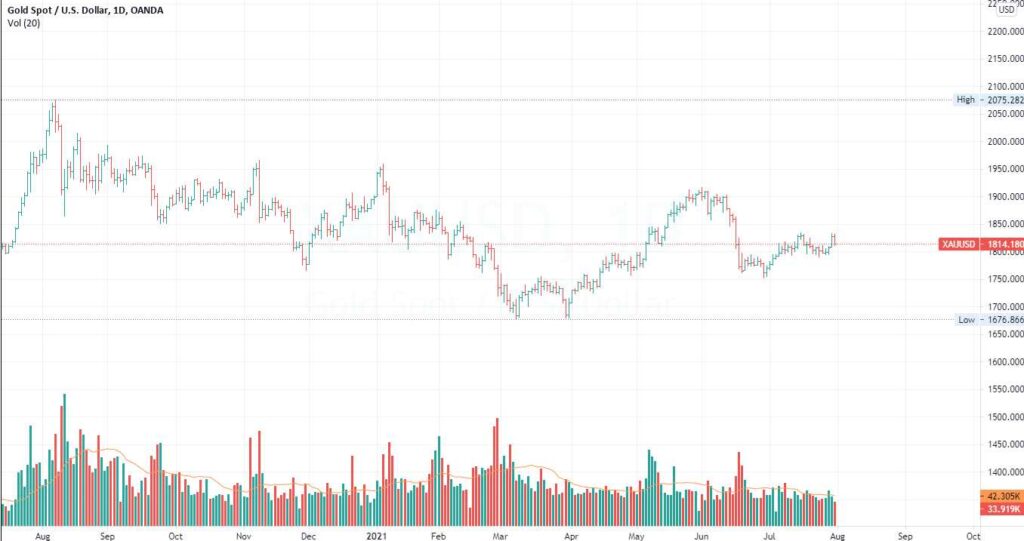
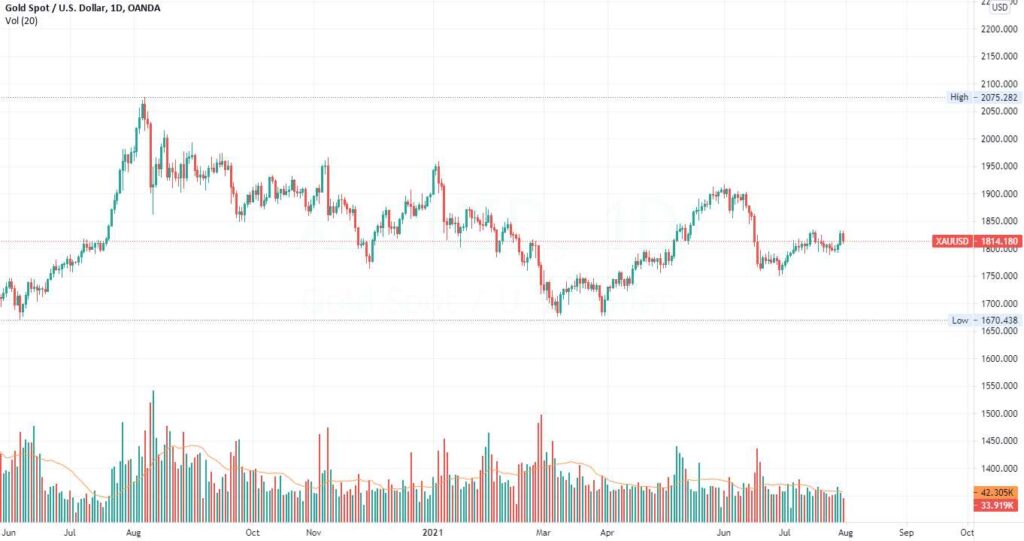
Some well known form of charts in technical analysis are –

  • Line chart.
  • Bar chart.
  • Candlesticks chart.
  • Heikin Ashi chart.

Line chart

line chart represents only closing price at the End of day. Do not provide information on trading range. Can be drawn also on open, low, high, close prices

Bar Chart

Bar chart represents whole price range of the day (HLCO). Each Bar represent one day price action. On left side tick shows open price and on the right side shows close price
bar chart

Candlestick Chart

Candlestick charts originated in Japan. This charting method was used as early as the mid-1600s to trade rice futures in the Japanese markets. Thin line is called as shadow & Wider portion is called as Real Body. Technical tools rely on the Color and size of individual candlesticks to signal trades.
Candlestick Chart

Heikin Ashi Chart

Heinkin means “average” and Ashi means “pace”. The Heikin-Ashi method uses average price data that helps to filter out market noise. A Heikin-Ashi Candlesticks use the open-close data from the prior period and the open-high-low-close data from the current Period
Heikin Ashi Chart

Share this Content

Technical Analysis